The 11th issue of Calameo Magazine is now available! Browse through our brand new issue on the theme of technological innovation:
If you’re passionate about technology, you’ll love this new issue of Calameo Magazine. We’ve got interesting stats, a spotlight on the metaverse and virtual worlds, as well as tips for using tomorrow’s tools in your marketing strategies, and a special Spotify playlist (and much more)!
💡TIP: Missed a previous issue? No worries! Check out the full archive and browse through each issue.
We hope you enjoy this 11th edition of Calameo Magazine! Tell us on Twitter (@Calaméo) what you think, and stay tuned for the next issue.
In the digital age, virtual libraries have become essential tools for organizing, sharing and accessing online resources. Thanks to technological advances and new solutions such as the Library Widget from Calaméo, it’s easier than ever to create a virtual library that meets users’ modern needs. In this article, we’ll explore the key steps to creating your own virtual library and show you how to make the most of the tools available.
A virtual library is an organized collection of digital documents, accessible online. Unlike ordinary libraries, virtual libraries offer unlimited accessibility, simplified content management and the ability to adapt to the needs of their users.
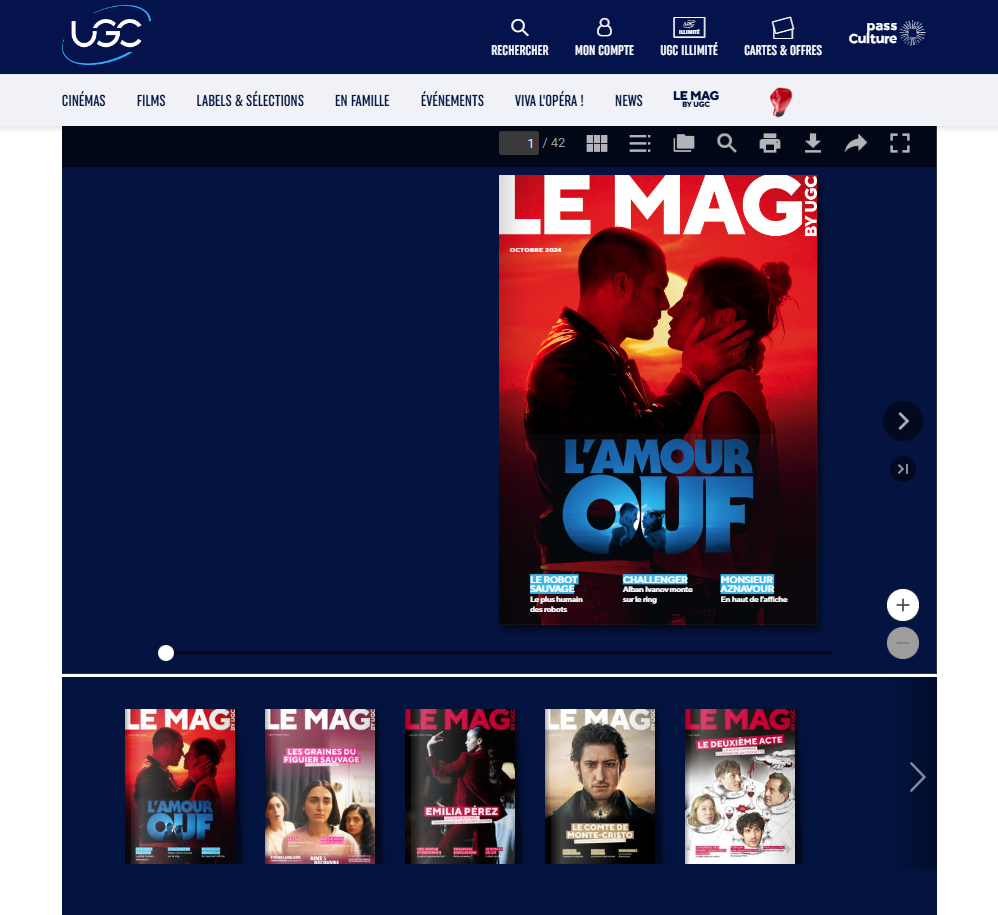
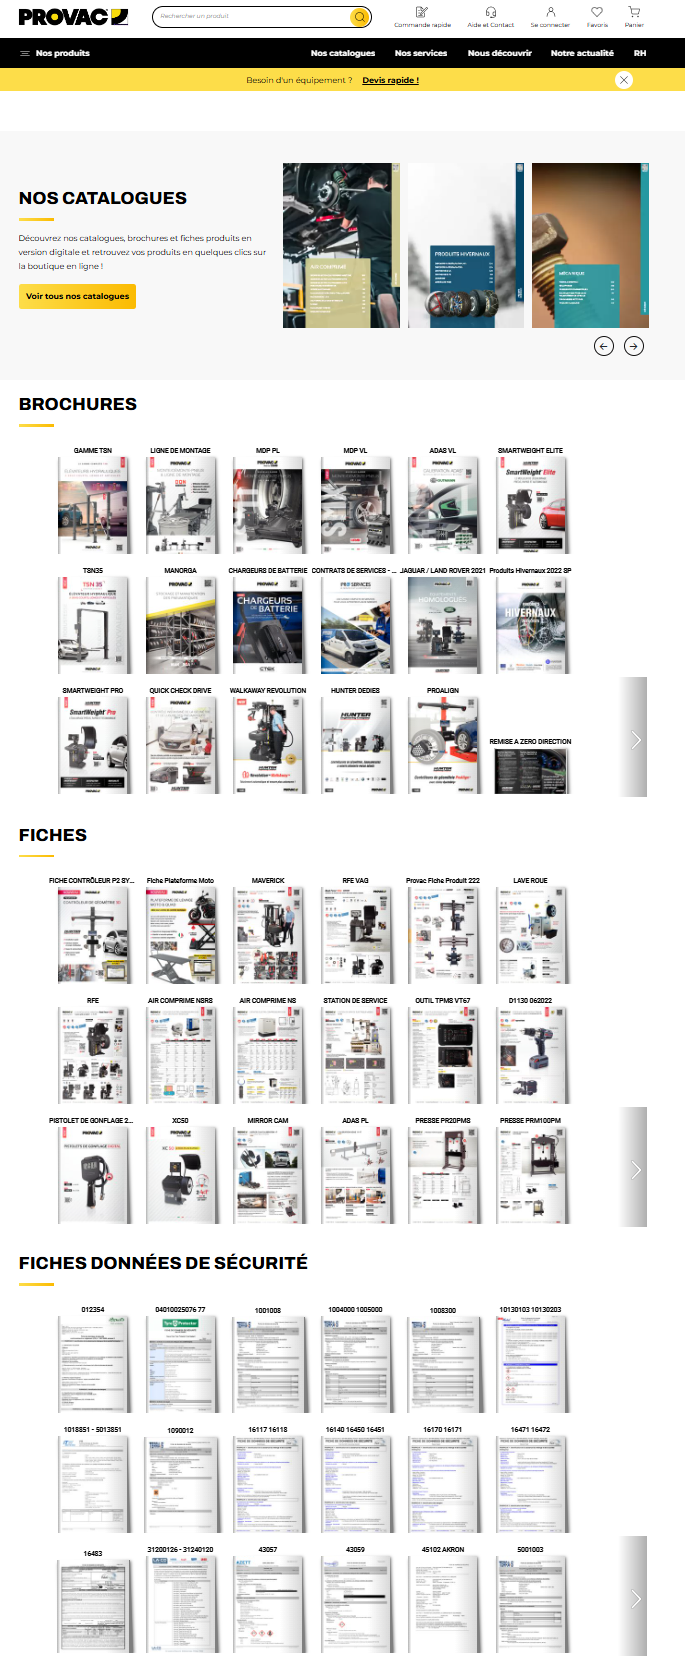
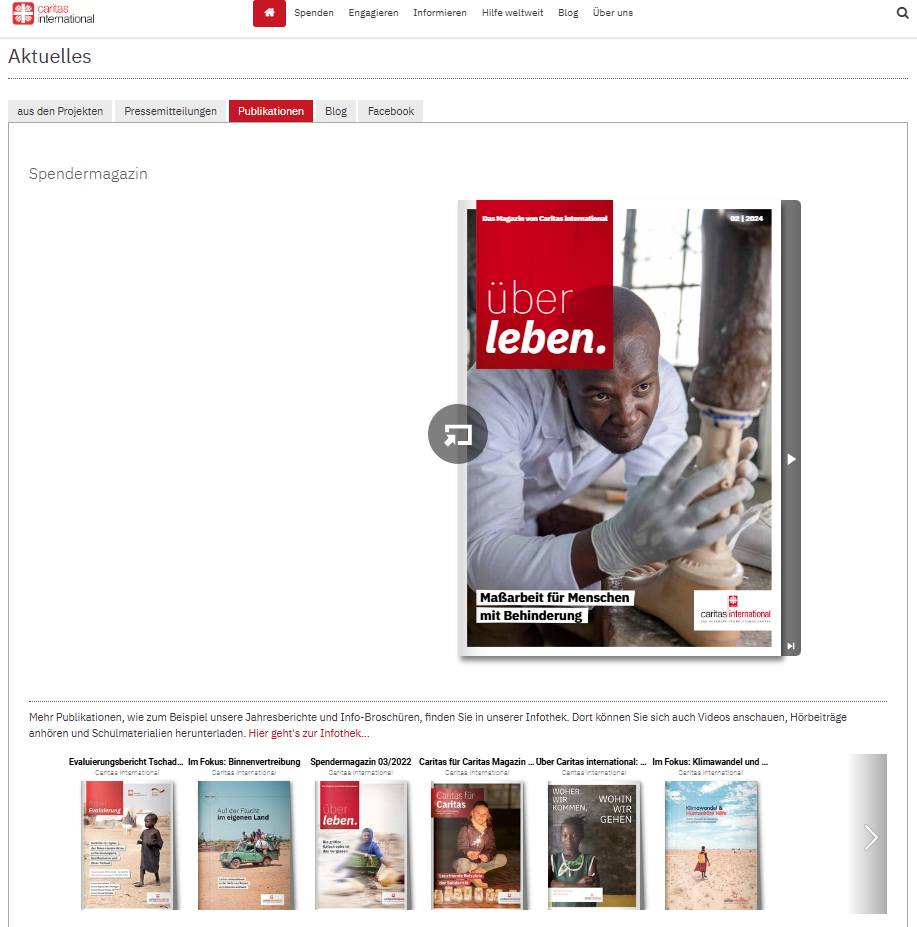
Here’s an example of a virtual library created with Calaméo:
Why you should create a virtual library: the major advantages
Optimized visual display
One of the greatest advantages of creating a virtual library is the simple, interactive way of showcasing your publications. Whether you want to display every issue of your magazine or a varied collection of documents, the virtual library enhances the visual impact of your content. Thanks to intuitive navigation, visitors can easily browse your virtual shelves and click on a cover to open the publication in full screen or in a new window. They can then easily return to your virtual library once they’ve finished reading.
Automatic updates
Automatic updates make it easy to manage your virtual library. Every time you add a new publication to your Library Folder on Calaméo, it instantly appears on your virtual shelves. By choosing to create a virtual library, you’re freed from repetitive manual management tasks. Removing publications is just as easy: mark them as private or move them to another Folder to adjust their accessibility with a few clicks.
In-depth analytics
When you create a virtual library, you also benefit from detailed analytics on how your audience interacts with your publications. You can track views, link clicks, downloads and traffic origin. These analyses enable you to adapt your content to better meet your audience’s expectations and improve engagement with your virtual library.
Why choose Calaméo to create your virtual library?
To create an effective virtual library, it’s essential to choose a platform tailored to your needs. Several solutions are available on the market, but the Library Widget from Calaméo stands out for its ease of use, intuitive interface and numerous advanced features. This solution is ideal for those who want to create a virtual library quickly and without any particular technical skills.
By using this feature, you benefit from :
Easy embeding on your website: Calaméo enables effortless embeding of your virtual library on your website, which means you can showcase your digital resources in a harmonious, professional way.
Visual customization to match your brand: Thanks to a variety of customization options, you can adapt the appearance of your library to reflect your brand identity and blend seamlessly into the pages of your website.
Numerous options for sharing and distributing your publications: With Calaméo, you can easily share your publications on social networks or by e-mail. This enables you to reach a wider audience and increase the visibility of your resources.
Step 1: Publish and organize your documents on Calaméo
Organizing your documents is a key step in ensuring an optimal user experience and smooth navigation in your virtual library. To ensure that your publications are easily accessible and well structured, it’s important to prepare them well before publishing them on Calaméo.
Start by publishing your digital documents on Calaméo. Each publication should be accompanied by a catchy, descriptive title, incorporating relevant keywords linked to your content. Don’t forget to fill in the description of each publication with clear, engaging summaries that will encourage users to discover your content.
Next, organize your publications by placing them in Folders or adding them to a Favorites list. For these documents to be visible in your virtual library, it is essential that Folders and publications are defined as public.
NOTE: Private publications will not be displayed in the Library Widget, giving you total control over what is visible to your users.
All you have to do is select the Folder (or favorites list) whose contents you wish to display in your virtual library. All public publications in this folder will automatically appear in your library, making it easy to manage your documents without any extra effort.
Step 2: Customize the appearance of your Library Widget
Personalizing your virtual library is essential to ensuring a user experience that reflects your brand identity. Thanks to the many customization options offered by the Calaméo Library Widget, you can adjust the appearance of your library so that it blends seamlessly with your website while reinforcing your brand image.
You can adjust the following elements of your Library Widget:
The texture or background color of the library to match the style of your website.
The number of shelves to display to visually organize your publications.
The size of your publication thumbnails for optimized display.
The information to be displayed for each publication (such as title or description).
The order in which your publications appear, allowing you to highlight certain strategic documents.
The way publications open (in a new window or full screen).
You can also adjust the appearance of thumbnails by choosing, for example, a shadow or other visual effects that enhance the impact of your publications. These subtle details play a key role in enhancing the aesthetics and navigation of your virtual library.
TIP: While you’re customizing the look and feel of your Calaméo Library Widget, you can see the changes in real time thanks to the preview function. This allows you to test different configurations and ensure that each modification fits perfectly into your overall site before finalizing the upload.
By customizing your virtual library with these options, you offer your users a fluid, visually appealing experience, while reinforcing your brand identity at every stage.
Step 3: Embed the Calaméo Library Widget into your website
Once you’ve carefully customized the look and feel of your virtual library, the next step is to embed it directly into your website. This step is crucial to making your virtual library accessible to your users and enabling smooth navigation between your content and the other pages of your site.
Embeding the Calaméo Library Widget is quick and easy, and you have several options for doing so. Once you’re happy with the configuration and design of your virtual library, simply copy the embed code provided by Calaméo. This code can be inserted on any page of your website, whether on a page dedicated to your publications or another section of your site.
This intuitive process makes it easy to present your digital document collections in a professional, interactive way.
READ MORE: If you need help with embedding, resources such as the tutorial or the support pagein the Calaméo Help Center are available to guide you step by step.
By embedding a Calaméo library on your site, you enable your visitors to easily explore your digital publications directly from your platform, without having to navigate to another site. This not only enhances the user experience, but also reinforces the consistency of your brand image by providing seamless access to your documents in a controlled environment.
Embeding requires no advanced technical skills and, once the code has been inserted, your virtual library will be automatically updated every time you publish new documents or modify existing ones. So you don’t have to worry about manually keeping your library up to date, which saves you and your team valuable time.
With just a few clicks, you can create a dynamic, scalable virtual library that blends seamlessly with your website, while enriching your users’ experience and facilitating access to your digital content.
Conclusion
Creating a virtual library represents a unique opportunity to modernize your content management and improve access to your digital resources. With the Calaméo Library Widget, you have a powerful and flexible tool at your disposal to set up a virtual library perfectly adapted to your needs.
Don’t wait any longer, transform the way you share information by starting to build your virtual library with Calaméo today!
In a digital environment where understanding user engagement is crucial, the integration of Matomowith Calaméo opens up new perspectives for analyzing and optimizing interaction with your online publications. Matomo, an RGPD-compliant, privacy-focused data analysis tool, enables website owners to collect detailed information about users, while respecting their privacy. Find out how the integration of Matomo on Calaméo can help you better understand your audience, personalize your marketing strategies, and improve the user experience of your digital documents.
What is Matomo and why you should use it with Calaméo?
Matomo is a prime alternative to Google Analytics for companies looking for ethical and secure analytics solutions. Fully RGPD-compliant, Matomo guarantees respect for private data while offering advanced analytics features. Thanks to its integration on Calaméo, you can now collect data on reader engagement, whether for sales brochures, product catalogs or other interactive publications. By associating Matomo with Calaméo, you benefit from a more complete and secure view of your users’ behavior.
Key benefits of integrating Matomo for your interactive publications
In-depth user engagement analysis
With Matomo, access comprehensive data on your visitors’ journey. You can track page views, time spent, clicks and much more. This information is essential for understanding which parts of your publications most captivate your readers, enabling you to adjust your content accordingly.
Customize tracking goals
Matomo’s integration with Calaméo lets you define tracking goals according to your needs: conversions, downloads or other specific actions. This flexibility helps you to precisely measure the performance of your documents and adapt your marketing strategies to maximize the impact of your publications.
Respect and protection of personal data
Matomo stands out for its commitment to data protection. Unlike other analytics solutions, Matomo gives you total control over your data, stored directly on your servers. This autonomy allows you to guarantee the confidentiality of your users, in full compliance with the RGPD, which is an asset for privacy-sensitive companies.
Optimizing your documents for an improved user experience
The information gathered by Matomo helps you improve the ergonomics and content of your publications. By understanding your readers’ preferences, you can adjust the layout, choose more relevant content, and create a smoother, more engaging reading experience.
Advanced audience segmentation
With the data segmentation offered by Matomo, you can analyze the behavior of different user groups. This segmentation enables you to better target your strategies and optimize audience engagement.
Conclusion: enjoy ethical, high-performance analytics for your Calaméo publications with Matomo
The integration of Matomo with Calaméo offers you a powerful solution for tracking, analyzing and optimizing the performance of your interactive publications. By choosing an analysis platform focused on data confidentiality and control, you strengthen the trust of your users while accessing essential information for your digital strategies. Embrace the Matomo integration today and turn every publication into an opportunity to improve your online impact.