If you’re looking to boost sales and cut costs in the retail sector, discover how Calaméo can transform your catalogs into interactive, engaging tools. Calaméo offers retail professionals an innovative solution for publishing, enriching and tracking the results of their content. Find out now how you can leverage the full potential of Calaméo to optimize your catalogs and build customer loyalty in the retail sector.
Enrich your interactive catalogs with Calaméo
With Calaméo, enriching your catalogs has never been easier. Publishing interactive catalogs lets you add images, videos and, above all, links to your website or product description pages. These links give your customers direct access to detailed information on each item, facilitating their purchasing process.
What’s more, by linking your Calaméo account with Shopify, you can make your store’s products available directly from your publications, creating a seamless, integrated shopping experience.
Going digital with Calaméo can significantly reduce your printing costs. Interactive digital catalogs offer an engaging experience, capturing your customers’ attention and extending your reach. This translates into increased conversions and sales.
Using Calaméo, you can update your offers instantly, eliminating the costs associated with regularly printing new catalogs.
What’s more,’s integrated analysis tools enable you to track user behavior, giving you valuable statistics with which to fine-tune your marketing campaigns. By recognizing which products are attracting the most interest, and detecting less-visited areas, you can optimize your offer and improve your sales performance.
If you’re looking to modernize your catalogs, Calaméo is the perfect solution. Easily integrate your interactive catalogs directly into your website to deliver a fluid, consistent user experience.
What’s more, white-label publishing enables you to protect your brand image while delivering high-quality content to your audience. This approach strengthens brand recognition and helps build customer loyalty.
Calaméo’s intuitive interface makes it easy to create engaging publications. With advanced features, you can capture your customers’ attention, encouraging them to explore your products and services in depth. By integrating interactive catalogs into your retail strategy, you’ll not only increase sales, but also strengthen customer loyalty.
Interactive catalogs represent a major revolution in the retail sector. By adopting this innovative approach, you can enrich your communication, maximize your profitability, and offer an unforgettable customer experience.
For years, downloadable PDFs have been the default format for presenting product catalogs. Convenient? Sure. But far from ideal—heavy files, limited interactivity, difficult to browse on mobile, and above all… they fail to showcase your brand’s full potential. Today’s readers expect a smooth, dynamic experience directly online. And that’s where Calaméo changes the game.
In this article, discover why your catalog deserves more than a simple PDF—and how you can transform it into a truly immersive experience with Calaméo.
The PDF: A static format that limits the user experience
A catalog isn’t just a list of products—it’s a full-fledged marketing asset. Yet the downloadable PDF format comes with key limitations:
No interactivity: no clickable links, no videos, no animations.
Not mobile-friendly: a print-designed PDF quickly becomes unreadable on a small screen.
No flexibility: impossible to add dynamic elements or update content easily.
The result? Readers lose interest faster, and your catalog falls short of the modern experience your customers expect.
Turn your catalog into an interactive experience with Calaméo
With Calaméo, you can publish catalogs directly online, with a polished and immersive reading experience. Here’s how your content reaches a new level:
Smooth and intuitive navigation: Calaméo offers natural page-by-page reading with dynamic page flips and a web-optimized interface.
Clickable links to boost conversions: Add links to direct readers to your website, product pages, or even checkout. With Shopping Links and Shopify integration, users can view product pages and purchase in just a few clicks.
Embedded videos, audio, and animations: Showcase your products in action with demo videos, animated GIFs, zoom zones, and more—bringing your catalog to life.
A perfect mobile experience: Unlike PDFs, Calaméo publications automatically adapt to all devices—desktop, tablet, and smartphone.
Easily optimize the reach of your catalog
Publishing with Calaméo goes far beyond simply putting a document online—everything is designed to increase visibility.
Embed on your website: Add your catalog in just a few clicks—ideal for product pages or your online shop.
Shareable on social media: Each publication has a unique URL, ready to share on LinkedIn, Instagram, Facebook, or via email.
Unlike downloadable PDFs, Calaméo gives you access to detailed analytics:
most-viewed pages
time spent per page
clicks on interactive elements
and more!
These insights help you understand what works, improve future editions, and better understand your audience.
Pro tip: You can also link your Calaméo account to Google Analytics 4 or Matomo to centralize all your stats in one place.
Conclusion
Your catalog is a strategic asset—it should captivate, inform, and convert. The downloadable PDF, while useful, no longer meets today’s expectations. With Calaméo, you deliver a modern, interactive, and engaging experience while maximizing content impact.
Virtual libraries offer a great tool for showcasing content on your website and keeping it organized. In fact, the easy-to-use Library Widget is one of our favorite digital publishing features on Calaméo. You can create your own virtual library, customize it and share in only a few clicks.
Let’s dive in to all the essentials of curating your virtual library!
A virtual library is a convenient, fun way to display a collection of digital publications. Just like a regular bookshelf, your virtual library allows you to bring together a group of materials in one place. It’s an inviting space where you can browse, read or simply show off your beautiful publications!
How to set up your own virtual library
You can make a virtual library in just a few minutes on Calaméo. In order to create a library widget stocked with your own Calaméo publications, go to the Publications tab of your account.
First, choose the Folder whose publications you wish to include in your virtual library. All of the public publications in that Folder will appear in your library shelves. (Your private publications are never displayed in the library widget.)
Next, click on the three squares icon at the top of the page to create your virtual library.
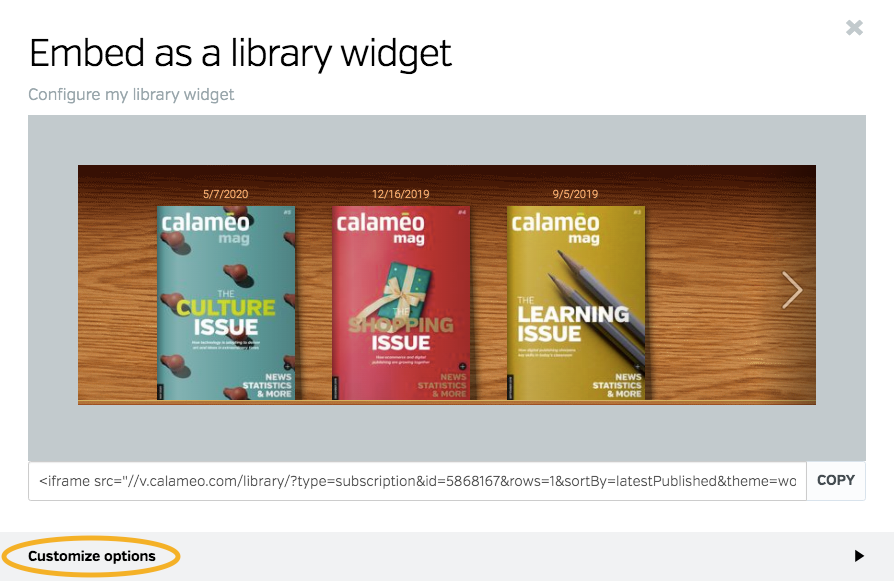
Finally, fine-tune the look of your library widget by clicking on “customize options”. You can select:
A background texture or color
How many shelves to show
The thumbnail size of your publication covers
Publication information to show
How to order your publications
How to open publications when clicked
Thumbnail design features like the cover drop shadow
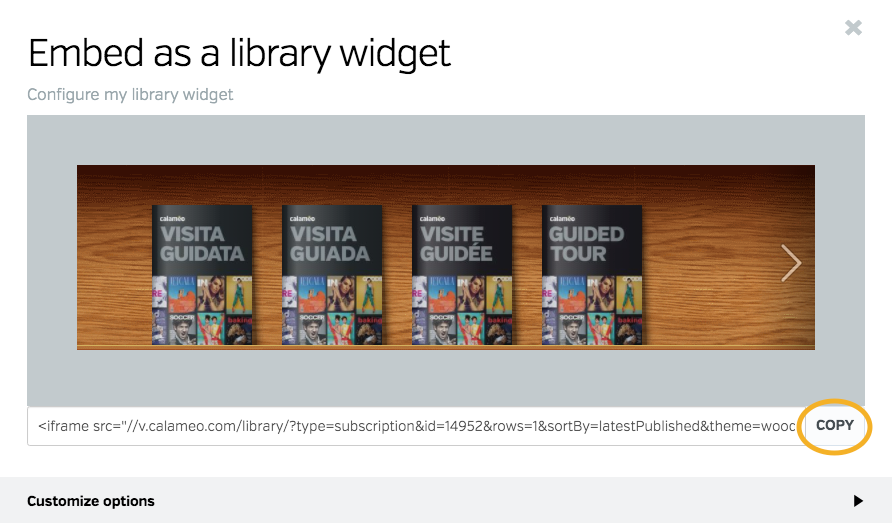
While you adjust the details, you’ll be able to see the changes in real time directly in the preview window. Once you’re happy with the appearance, just copy the embed code. And that’s it—everything you need to create your own virtual library!
Watch our video tutorial on how to create a virtual library below:
💡 TIP: Prefer to view the tutorial in a different language? Use the Settings icon in the video player to select your subtitles.
How to display a virtual library
Congratulations—your library widget is all set up and ready to go! Meanwhile, the next step is to consider how you would like to share your virtual library. For example, you might want to display your publications on your website or blog. Or perhaps you’d rather have a link to email to friends, contacts or customers.
Libraries on your own website
Sharing your virtual library on your own blog or website is a piece of cake. After you have finished customizing the design of your bookshelves, copy the HTML embed code.
If your site is built with WordPress or Joomla, you can install our plug-in and paste the code right into a blog post or page. For example, this code:
However, other websites may require you to specify a container for your virtual library. Consult your CMS’s specifications or check with your webmaster for more information.
To display all of the publications in your virtual library on Calaméo, you can share a link to a Folder or Favorites list. Although the bookshelf interface is not available on Folder or Favorites pages, your audience will be able to view and explore the entire collection.
Linking to a Favorites list
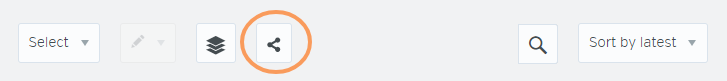
To share a Favorites list, start by going to the Favorites tab of your account. Then select the list that you want to share from the left-hand menu. Finally, click the Share icon. In the window that opens, copy the URL and start sharing!
Linking to a Folder
To share a Folder, head to the Publications tab of your account. Choose the Folder whose publications you want to share from the left-hand menu, then click the Share icon. Grab the link to your Folder and you’re set to share.
Why make a virtual library
There are lots of great reasons to create your own virtual library. In fact, we reviewed 10 of the best for anyone who needs convincing! But to keep things simple, here are the top three benefits of a library widget.
Perfect presentation
The biggest advantage of a virtual library is the easy, interactive way it lets you showcase different publications. Whether the shelves are filled with every issue of your magazine or a variety of materials, a library widget can boost your publications’ visual impact.
Plus, browsing your publications in a virtual library is a breeze thanks to its intuitive navigation. Visitors can click any cover to open the publication in full screen or a new window, then return to your library when they’ve finished reading.
Painless updates
Another great feature solves a major headache for many publishers: the content in your virtual library updates automatically. Whenever you add a new publication to your library’s Folder on Calaméo, it also appears on your embedded bookshelf. As a result, you never need to worry about manually importing content to maintain your site.
Likewise, removing publications from your virtual library only takes a minute. Set them to private, move to a different Folder or deactivate out-of-date materials.
Extra insights
You’ll benefit from useful viewership analytics when you create your own virtual library on Calaméo, too. Because it’s important to know where your audience comes from and how they interact with your content, your account statistics show library details. You’ll see what percentage of your publications’ views happen in your virtual library, as well as other advanced statistics like link clicks and downloads.
In conclusion, setting up a digital bookshelf couldn’t be simpler. All you need to start is a free Calaméo account! Join today and create your own virtual library.