Compared to printed material, digital communications have a lot of advantages. For one thing, they’re great if you want to go paperless. For another, it’s a lot easier to add a GIF to an online newsletter than to a piece of paper. But a truly revolutionary business advantage is the ability to track analytics for your digital publications.
Because analytics are so important, it can be intimidating to get started. If you’re wondering how to follow your Calaméo publications’ statistics, this is the guide for you! From the very basics to best practices, we’ll cover everything you need to know about analytics on Calaméo.
- What does “analytics” mean?
- How to use your Calaméo analytics
- Identifying KPIs for your publications
- Tips to optimize performance
- Publications analytics: Best practices
What does “analytics” mean?
First of all, you might be wondering what exactly we mean by “analytics”. Although the word has been around a long time, it’s become much more popular since 2000. That’s because analytics specifically refers to examining and getting insights from data. Since the early 2000s, businesses have adopted digital technologies and enjoyed access to huge amounts of new data. Analytics help them understand and use that data.
As a result, analytics are increasingly important to all kinds of businesses. For Calaméo users, your online publications generate lots of great data. In this guide, we’ll show you how to find Calaméo analytics and the most valuable takeaways for your digital content.
How to use your Calaméo analytics
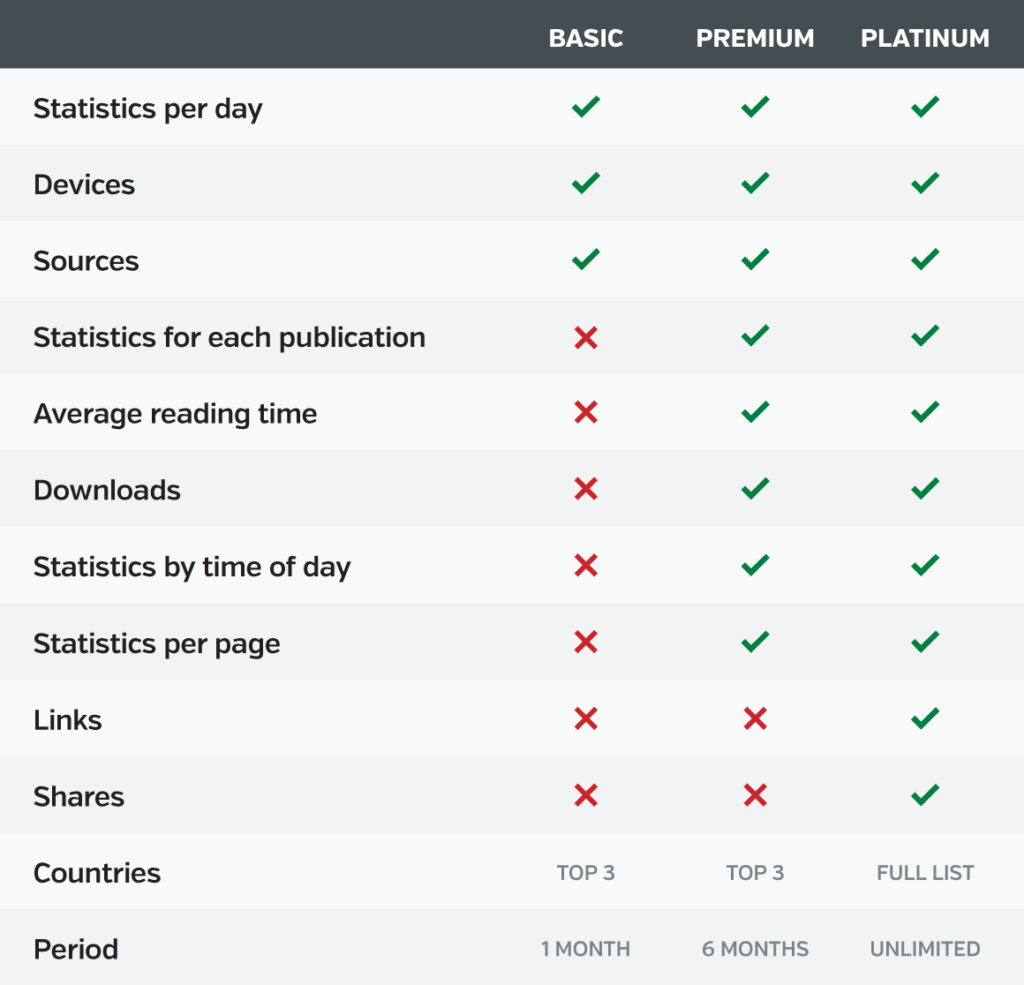
Good news: Viewership statistics are available for every Calaméo user. (Another reason why digital publishing on Calaméo is best in class!) However, the type of information that you can see will depend on whether your account is BASIC, PREMIUM or PLATINUM. Here’s a handy chart of available data for each plan:
Lifetime statistics
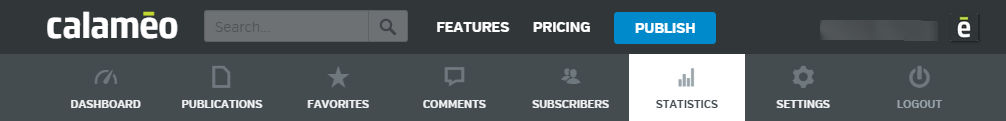
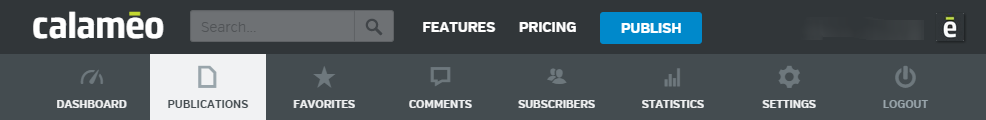
The easiest way to get to your publications’ analytics is by going to the Statistics tab in your Calaméo account. To start, make sure you are logged into your account. Next, display the top navigation bar. Click on the Statistics section.

In this section, you will find an overview of your account’s lifetime statistics. In other words, you can check the total number of views for all of your publications combined. Plus, you’ll see other interesting lifetime data in this section depending on your account type.
For all accounts, several features let you explore more about your publications’ viewership. Scroll down to:
- Change the time period displayed
- Drill down into key statistics like Clicks and Downloads
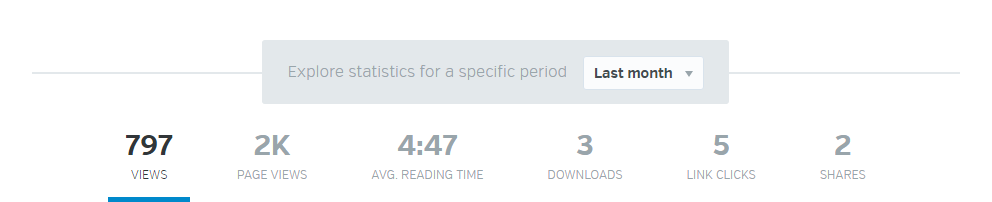
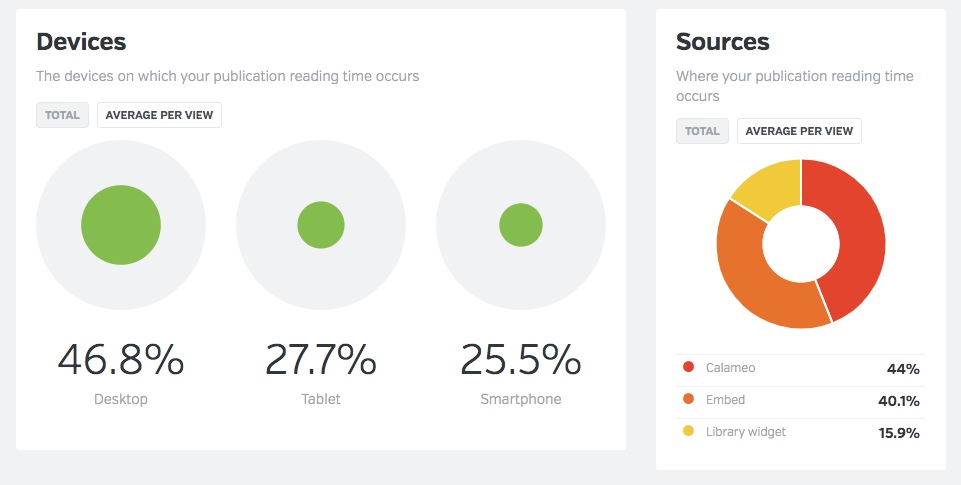
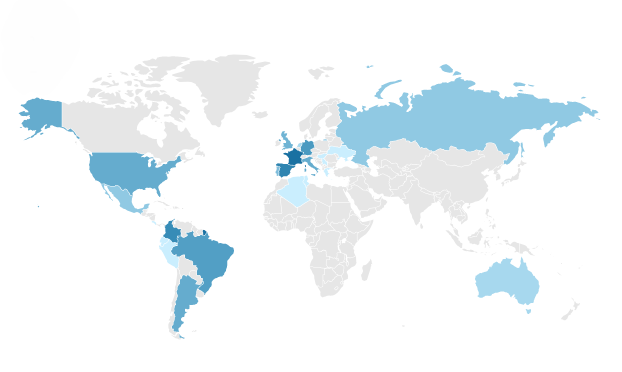
- Discover other useful dimensions like Device, Source and Countries
Publication statistics
However, note that the Statistics tab provides info about all publications associated with your account. To track data for individual publications, you will need to go to the Publications tab of your account.
Find the publication you want to investigate and click the arrow. In the drop-down menu that opens, choose “View statistics”.
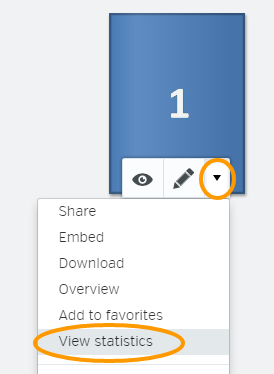
You can now explore the available data for just the selected publication.

Finally, PLATINUM users may connect their Calaméo accounts to Google Analytics. This powerful feature lets you integrate Calaméo data directly into your existing web analytics set-up.
💡 TIP: Want to see how using Calaméo with Google Analytics works for your business? Request your PLATINUM Demo today and test this exclusive feature for two weeks—absolutely free.
Identifying KPIs for your publications
After you’ve had a chance to explore your Calaméo statistics, it’s time to consider which analytics are the most important for your publications. Because the goal of analytics is to generate useful insights, deciding what information interests you is a major step. Or to put it another way, you’ll want to choose key performance indicators to follow.
Define business goals
To start, spend some time thinking about the main business goals associated with your online publications. Your specific goals will be unique, but here are a few common examples:
- Growing awareness of your company, programs or services
- Building a loyal audience for your brand and publications
- Generating leads for your sales and marketing strategies
- Increasing online revenue through your e-commerce operations
Different KPIs can help you measure progress on each one of these goals. For instance, publication views are a good indicator of awareness. On the other hand, the number of pages viewed and reading time better show your audience’s engagement. Download data may match how many leads came from a publication. And link clicks to your online store reveal what appeals to your shoppers.
Most of all, think about the information that matters to you. If you hope to expand your international reach, country data might be a top KPI to track.
Set KPIs and benchmarks
Select two to four KPIs for your publications, then gather the first set of data. This will give you a sense of where you are now in relation to your goals. Then, pick benchmarks for your KPIs to get a sense of where you want to be going. For example:
- Awareness — 500 views / month
- Leads — 25 downloads / month
- International reach — 10% of views and downloads from Canada
💡 TIP: SMART goals are smart goals for online content. Learn more about the SMART framework here.
Once you’ve finished identifying KPIs for your publications, take a look at our advice for ways to boost your results!
Tips to optimize performance
Since we began Calaméo all the way back in 2008, we’ve learned a thing or two about what works in digital publishing. Although there’s no guaranteed, easy trick for success, these simple tips are a good place to start.
Views
Beyond having great content, an unbeatable strategy for getting more views is to share your publications widely. Make it easy for your audience to discover your online publications! With Calaméo, you can:
- Distribute links by email
- Share on social networks
- Embed on your own website
- Make a fun virtual library
Page views & Reading time
Both of these analytics point to the level of engagement that viewers have with your publications. First, the number of page views tells you how much of your publication was opened per view. That is to say, did your audience view your publication past page one? Or all the way to the last page?
Next, reading time tells you how long audiences spent viewing your publication. Views with longer reading times and more page views suggest higher engagement than shorter reading times and fewer page views. And higher engagement means a bigger impact!
Some ways to improve engagement analytics are:
- Optimize your documents for digital publishing
- Test your publications on mobile
- Add interactive, multimedia content
Downloads
In recent years, offering content for download has become a key content marketing strategy. But even if you’re not focused on generating leads, direct downloads make for great user experience. When your audience gets to keep a copy of your publication, they can return to it anytime—even offline.
Here are a few effortless tips for boosting your results:
- Enable direct downloads for your publications
- Include clear calls to action (CTAs)
- Offer exclusive content
CTR
The click-through rate, or CTR, reveals how many viewers click the interactive links in your Calaméo publications. (More specifically, it calculates a percentage: the number of times a link was clicked divided by the number of times the relevant page was displayed.) Your advanced Calaméo statistics track the number of clicks and CTR for every link in your publications. Best of all? You can filter to focus on external, video, audio or Shopping links.
Start optimizing your links with these ideas:
- Our tips for boosting CTR
- Use a variety of different link types
- Make links stand out with a custom theme
Shares
Although sharing to social media networks isn’t as big as it used to be, shares are still a good way to reach new audiences. That’s why our publication viewer includes a handy share button! But did you know that Calaméo’s PLATINUM statistics have detailed sharing data? See where, when and how your publications were shared from the viewer.
And to encourage sharing, you can:
- Optimize your publications for social media
- Add social buttons to the viewer
- Follow shares outside of social media
Publication analytics: Best practices
Now that you’ve gotten familiar with Calaméo’s analytics, chosen KPIs to track and optimized your publications, you can sit back and relax! To get started with analytics, most of the hard work happens at the beginning. However, there are a few important best practices to keep in mind for the future.
Be consistent.
Since you already know what information interests you, make sure you stay focused on consistent KPIs over time. Whether weekly, monthly or quarterly, collect the same stats on a regular schedule. Then, identify trends.
Be organized.
If you have access to limited statistics on Calaméo, you may wish to transfer your analytics to a separate document for tracking. Don’t misplace this data—analytics are especially useful to understand long-term trends.
Be flexible.
As time goes on, you might find that the KPIs you’re following are not connecting to your goals the way you expected. In that case, press pause and explore what isn’t working. You can rethink and adjust how you use analytics tools moving forward.

And there you have it—our complete guide to analytics on Calaméo! We hope you enjoy diving into insights and data about your digital publications. Have questions? You can write to us anytime at contact@calameo.com.