When you’ve worked hard on creating a great publication, having more choices is always a good thing. That’s why we’re so pleased to announce that there is now a new option for including video in your digital publications on Calaméo!
From now on, you will be able to embed video elements that play directly on the page of your publication without opening a pop-up overlay. Your readers can move seamlessly from browsing an article to watching a video clip and back again.
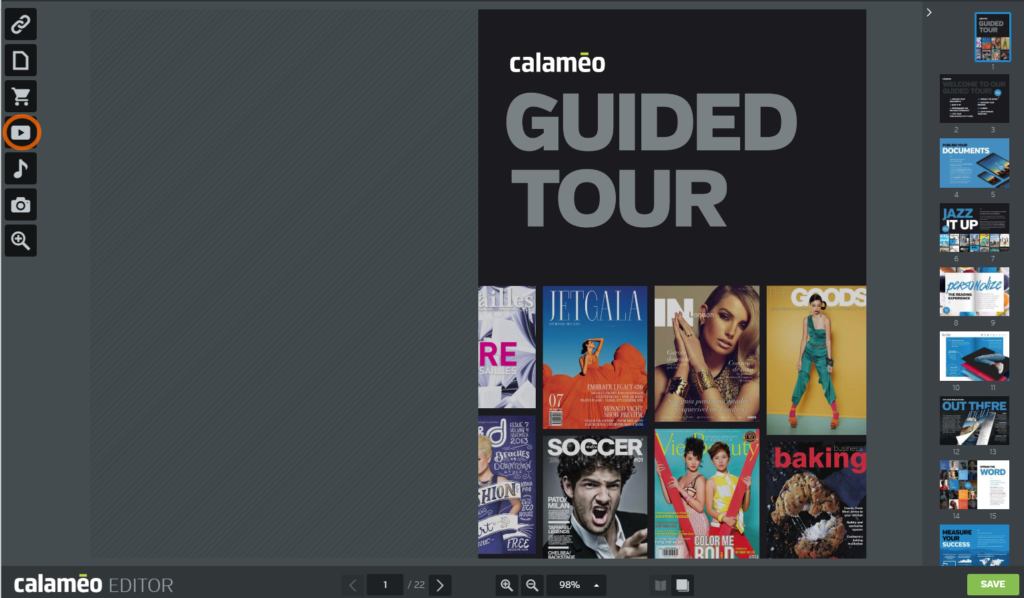
All you need to do is open your publication in the Calaméo Editor, go to the page you want to modify and select the video icon.
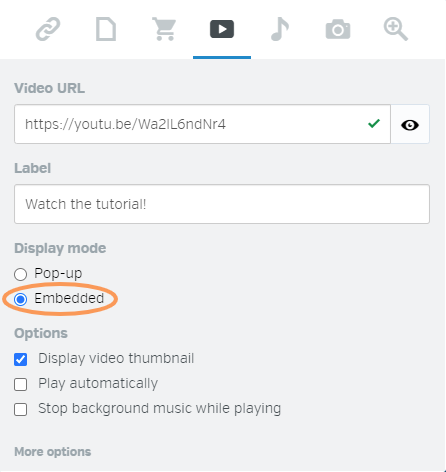
Adjust the blue zone so that it appears where you wish the video to play and add the video URL and text label in the video properties window. Then, choose “Embedded” from the Display mode drop-down menu.
You can also choose whether you would like to display the video thumbnail, begin playing the video automatically when the reader turns to this page and mute any background music while the video plays.
💡 TIP: Want embedded videos to play with sound? Don’t opt for autoplay. By default, your readers must click for sound on videos that start playing automatically.
Save your work and view your publication to see the video embedded right on the page!
Of course, you’ll still be able to choose the classic pop-up player for your videos. Just select “Pop-up” from the Display mode options when adding video to your publication in the Calaméo Editor.
Looking to get a handle on your video strategy? Check out our guide to promoting content on YouTube. Then visit our YouTube channel to watch tutorials on using our Editor and more.
Choosing a white label publishing platform for your online documents can have many benefits for your business. Read on to learn more about digital publishing in white label and the solutions offered by Calaméo.
What is white label publishing?
White label, or private label, describes a product that does not have branding attached to it before use. This can include the company name, product name, logo and any other features that connect it to the maker. In most cases, users of white label products then add their own branding to make it their own.
A white label publishing platform lets users upload and share documents without outside branding and advertising. For example, Calaméo’s digital publishing platform offers a white label feature for professional users. When you publish in white label, Calaméo logos do not appear on the publication viewer. In addition, viewer menus don’t display third-party content.
The end result? No mention of Calaméo anywhere inside the viewer.
Why should I choose a publishing platform with white label?
There are many good reasons to select a white label publishing platform for your online documents.
Discretion
First, you remove any distractions from the publication viewer and keep all the focus on your documents. Rather than call attention to tools your business uses, white label provides a discreet solution.
Rebranding
Next, the best white label publishing platforms will allow you to rebrand the document viewer as your own. Why settle for a neutral reading experience when you can take your publications to the next level? Plus, adding your company’s own logo is simple with Calaméo. Thanks to our awesome Elements feature, it only takes a few clicks to upload and apply a logo to your digital publications.
Flexibility
In fact, the biggest advantage of a white label publishing platform is flexibility. Because the solution is meant to be adapted to your needs, look for tools that enable you to customize your publications. For instance, Calaméo’s custom theme feature lets you define practically every detail of the viewer, from color and design to languages and behaviors. Go ahead—make it your own!
How can I publish in white label?
If you’re ready to start publishing your online documents in white label, then it’s time to join Calaméo. Signing up is free and easy, and you can explore all of the ways that digital publishing on Calaméo is best in class right away with our BASIC plan.
Go pro
Publishing in white label is a feature of our platform’s PLATINUM plan. Created specially for professional users, the PLATINUM offer on Calaméo is packed with essential options like custom account URL and direct downloads. Once you upgrade to PLATINUM, you’ll automatically enjoy a white label publication viewer. In other words, there’s no box to check or submenu to navigate—just your documents, ready to go in white label.
Embed
However, to avoid referencing Calaméo in the publication URL, you should embed it in your website or blog. By opting for an embed in “Publication” view, you can share via your own URL. Check out our Complete Guide to Embeds for an illustrated tutorial and extra tips.
💡 TIP: Use the “shareurl” parameter in the embed code to specify your own URL for your readers to share.
What will my publications look like in white label?
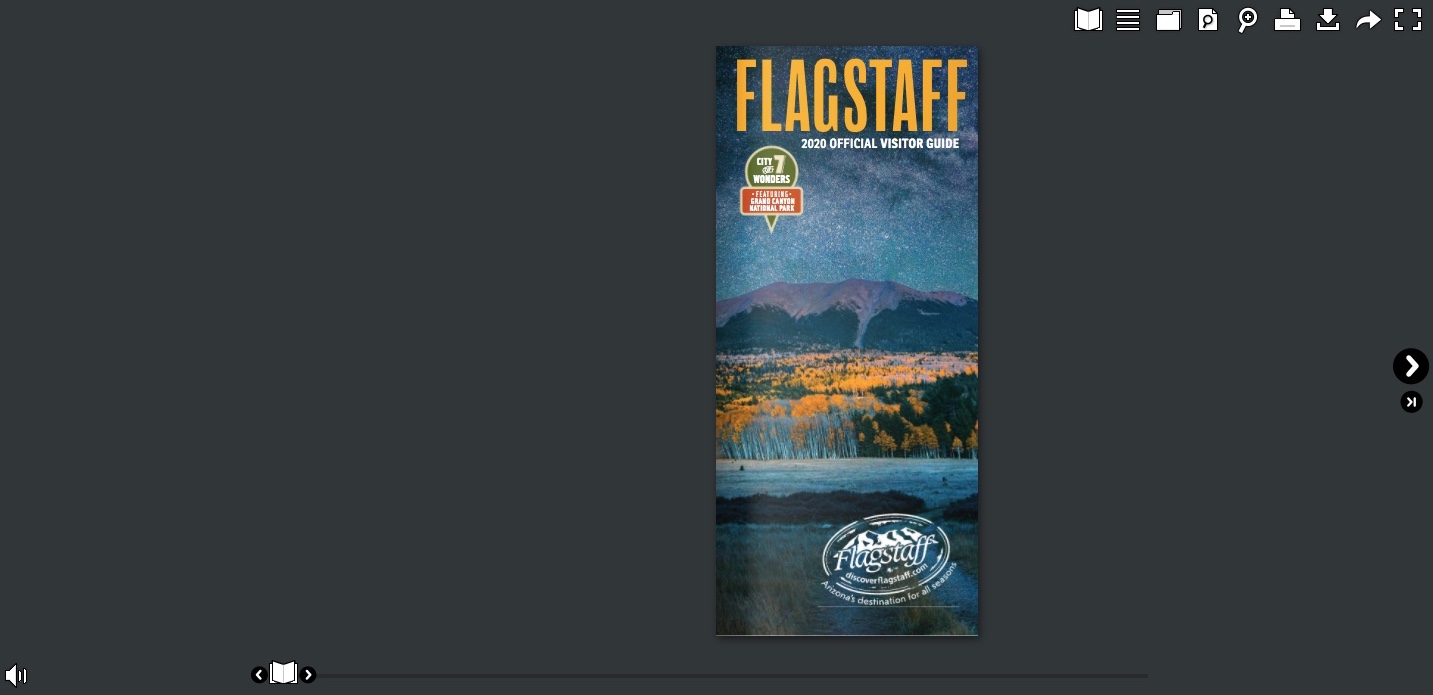
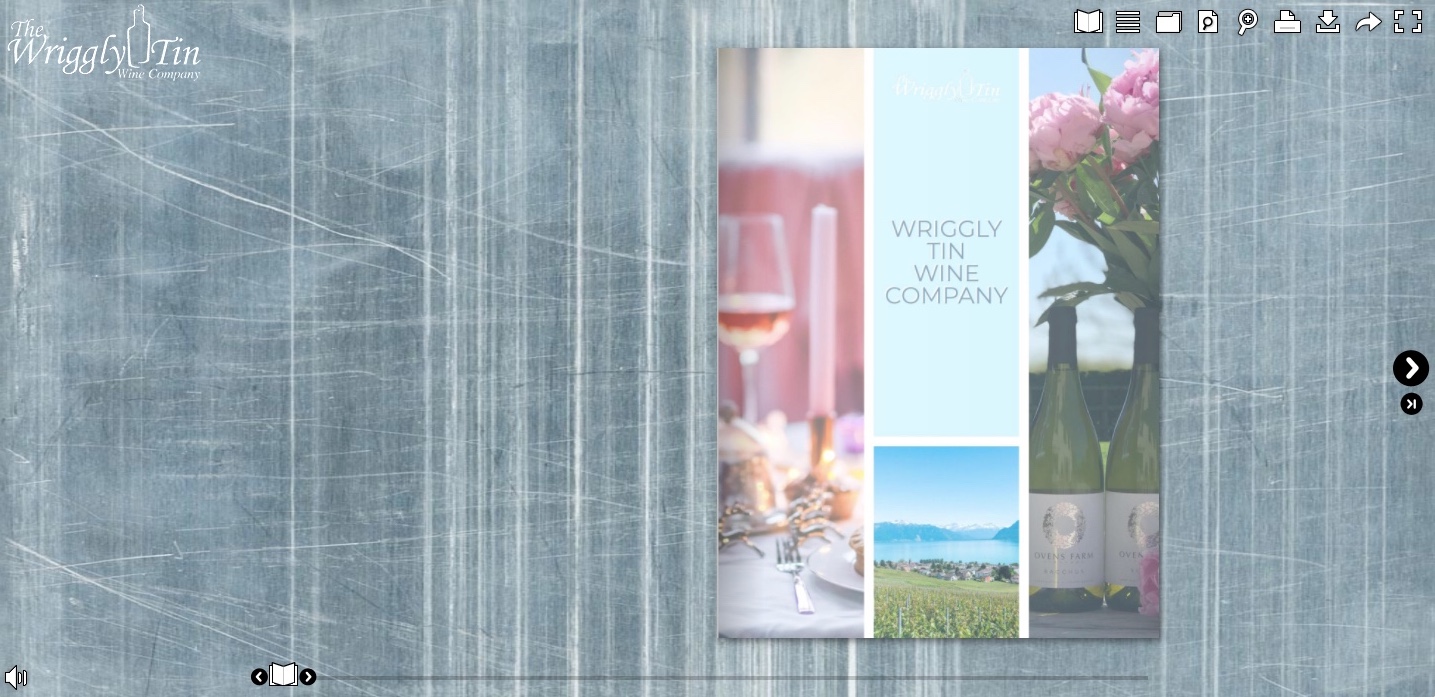
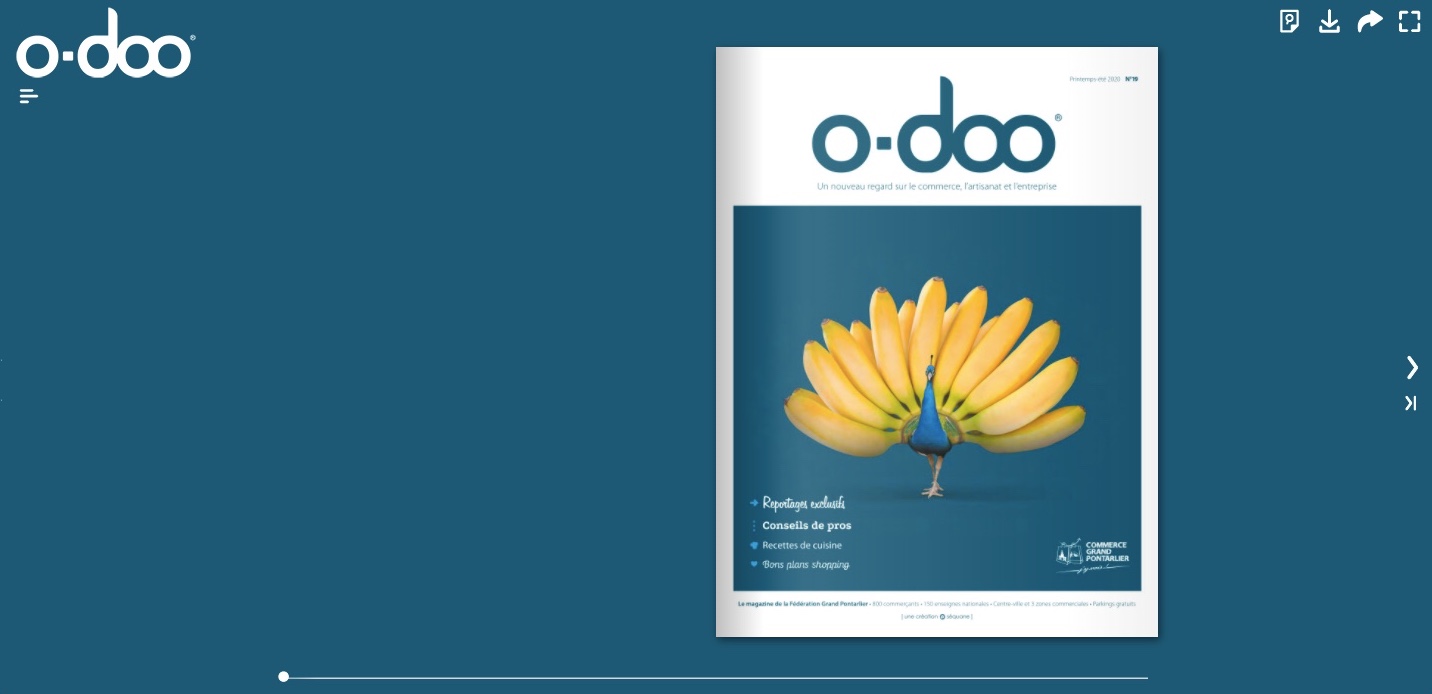
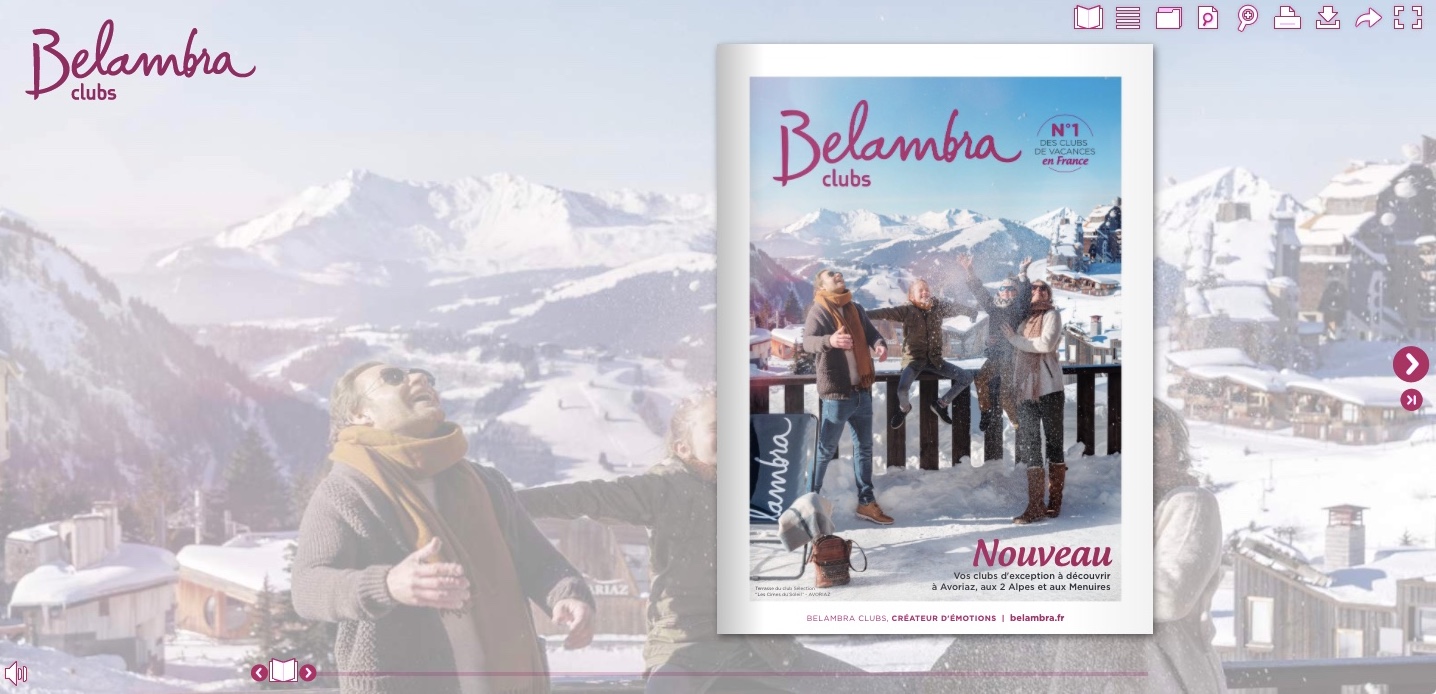
Most important of all is how your documents actually look with a white label publishing platform. Here’s an example of a publication in our white labeled viewer on Calaméo:
Interested in finding out how publishing in white label works for your documents? Request your 14-day free PLATINUM demo today and put our professional features to the test.
Flash is now just a long and distant memory in the digital sphere, which makes us even more delighted to have successfully released our state of the art HTML5 publication viewer to the world—a form of technology that our users will be able to rely on for years to come.
But now is time for some greater changes. Today we are proud to unveil a re-imagined cutting-edge digital publishing experience using the latest technologies. We hope you like it!
The Technology
Our high performance document viewing solution offers publishers and readers alike an outstanding display of crystal-clear, full screen document reading. The new updates reflect the incredible technological advances in the industry and we are so proud to have created something that is both unique and technically sound.
The innovative Calaméo conversion technology is thoughtful of details and offers various new benefits for our users. Here are a few key improvements:
Better Reading Experience
With Calaméo, you don’t have to deal with blurred documents that you might see on some of our competitors’ platforms. Our new conversion offers an enhanced zoom, sharper text and vibrant images just like a print document!
Competitors’ Document Conversion Vs Calaméo’s Document Conversion
Smarter Document Conversion
We’ve made converting your print documents to digital easier than ever! Our document conversion technology enhances the HTML5 viewer for high-speed loading of documents, which makes publishing on Calaméo considerably more efficient.
Universal
Have no fear, our conversion technology is compatible with any browser and adapted to all desktop and mobile devices for smooth and seamless reading—no plugins required!
The Journey
Our team of developers worked long and hard to craft an advanced document conversion technology that not only serves to complement our sophisticated HTML5 viewer but is also tailored perfectly to our users’ needs.
Our team achieved amazing results and have succeeded in keeping 100% of the Calaméo features you know and love. Essentially, we’re offering you the same online solution but with excellent performance enhancements that will be available on all Calaméo publications; whether embedded on third party websites, blogs or social platforms.
Our new technology will progressively roll out by default on all future publications, we can’t wait for you to try it!
Join the Conversation
Tell us what you think about Calaméo’s latest evolution! We would love to hear from you on our social media channels. Reach out on Facebook, Twitter or LinkedIn with your comments.